Infographic Dumps - Images
![Media Consolidation: THE ILLUSION OF CHOICE Melia hes never been more eonsolidenel 6 media glants now oantral ntaggering 90% cEwhatwo raad, watch, or linen ta CONSOLIDATION 277 MILLION AMERICANS $275,9 BILLION TELEVISION 3 NEWS READ TIME WARNER NEWS NEWS CORIP p OWNS THE TOP 4 RADIO CLEAR CHANNEL OWNS 1,200 STATIONS NON-STOP PLAY 50 MOVIES S 2X THE Box OFFIC E SALES OF MERGERS END FRUGAL DAD](https://i.kym-cdn.com/photos/images/masonry/000/327/475/2f5.jpg)
![Media Consolidation: THE ILLUSION OF CHOICE Melia hes never been more eonsolidenel 6 media glants now oantral ntaggering 90% cEwhatwo raad, watch, or linen ta CONSOLIDATION 277 MILLION AMERICANS $275,9 BILLION TELEVISION 3 NEWS READ TIME WARNER NEWS NEWS CORIP p OWNS THE TOP 4 RADIO CLEAR CHANNEL OWNS 1,200 STATIONS NON-STOP PLAY 50 MOVIES S 2X THE Box OFFIC E SALES OF MERGERS END FRUGAL DAD](https://i.kym-cdn.com/photos/images/original/000/327/475/2f5.jpg)
Infographic Dumps
A Chronicle of the Evolving GTLD Landscape
![A CHRONICLE OF THE EVOLVING 1930 GTLD LANDSCAPE APPLICATIONS GTLD APPLICATIONS BY REGION 911 675 EUROPE NORTH AMERICA 24 303 AFRICA LATIN AMERICA & CARIBBEAN ASIA-PACIFIC TOP PLAYERS 54 Uniregistry 13 MOST POPULAR GTLD APP APPLICATIONS 80 TLDH Limited Google Inc. 304 HOME INC ART Donuts 1706 GENERIC NEW GTLDS BY TYPE 485 BRAND 84 116 IDN COMMUNITY GEOGRAPHIC VISIT POOL.COM/LABS TO START EXPLORING Pool.com Getting you in the game OPool.com Discovery Labs 2012 : www.p l.com/labs 13, 2012 Source: Data based on ICANN new gTLD applicant data released](https://i.kym-cdn.com/photos/images/masonry/000/326/776/db9.png)
![A CHRONICLE OF THE EVOLVING 1930 GTLD LANDSCAPE APPLICATIONS GTLD APPLICATIONS BY REGION 911 675 EUROPE NORTH AMERICA 24 303 AFRICA LATIN AMERICA & CARIBBEAN ASIA-PACIFIC TOP PLAYERS 54 Uniregistry 13 MOST POPULAR GTLD APP APPLICATIONS 80 TLDH Limited Google Inc. 304 HOME INC ART Donuts 1706 GENERIC NEW GTLDS BY TYPE 485 BRAND 84 116 IDN COMMUNITY GEOGRAPHIC VISIT POOL.COM/LABS TO START EXPLORING Pool.com Getting you in the game OPool.com Discovery Labs 2012 : www.p l.com/labs 13, 2012 Source: Data based on ICANN new gTLD applicant data released](https://i.kym-cdn.com/photos/images/original/000/326/776/db9.png)
Infographic Dumps
![from.com to.brand The web is changing NOW FUTURE 300-1000 APPLICATIONS 仚 모 com□.net.canon anticipated on bank ·bank $185,000 USD org to apply nyc interest is growing.. creating short, memorable names FROMTO powershot.canon http://wwwusa.canon.com/cusa/consumer/products/cameras/digital_cameras all types of brands are keen BIG brands... 19% 19% 15% 7% 7% Entertainment Financial services IT & Telcos $36.7 BILLION E Travel & tourism Consumer goods average market cap mostly to protect their brands 45% but also for competitive advantage. SOURCE: MELBOURNE IT DIGITAL BRAND SERVICES](https://i.kym-cdn.com/photos/images/masonry/000/326/716/86d.jpg)
![from.com to.brand The web is changing NOW FUTURE 300-1000 APPLICATIONS 仚 모 com□.net.canon anticipated on bank ·bank $185,000 USD org to apply nyc interest is growing.. creating short, memorable names FROMTO powershot.canon http://wwwusa.canon.com/cusa/consumer/products/cameras/digital_cameras all types of brands are keen BIG brands... 19% 19% 15% 7% 7% Entertainment Financial services IT & Telcos $36.7 BILLION E Travel & tourism Consumer goods average market cap mostly to protect their brands 45% but also for competitive advantage. SOURCE: MELBOURNE IT DIGITAL BRAND SERVICES](https://i.kym-cdn.com/photos/images/original/000/326/716/86d.jpg)
Infographic Dumps
![KICKSTARTER behind the numbers the failures As of s/2/2012 $214,588,334 pledged 2,974,842 bac kers 45,815 projects 22,902 successful projects (B 5%) 18,939 failed projects (0 1%) Fated (41 3% of the $214,588,334 pledged.. $197,592,643 successful (92 1%} 16,995,69 Fated (7 9%) successfully funded % OF SUCCESSFUL PROJECTS Design Fam & Video Art 10 50 70 MOST MONEY RAISED Dance 1.8 MM Fashion 2.3 MM Comics 4.8 MM Food 1 MM Theater 6.8 MM 22.7 MM 6.3 MM Fim & Video 20 milion 40 milon 60 miaion MOST POPULAR/COMPETITIVE Comics 1,068 Food 1.471 # of projects submitted Fim & Video 2000 4000 6000 8000 10000 12000 1000 Dance ■26,326 Fashion .36,792 Pholography50,552 Food 85.179 # of backers 0 100000 200000 300000 400000 500000 600000 700000 Duration of Fundraising Campaign SUCCESSFUL PROJECTS AVERAGE AILED PROJECTS AVERAGE 38 43 VS DAYS DAYS Set Goal SUCCESSFUL ROJECTS AVERAGE FAILED PROJECTS AVERAGE $5,487 VS. $16,365 Lower goal 8.5% of funded projects received more than double their goal (>200%) PPS BLOGGER Sourcei Kickstarter.com](https://i.kym-cdn.com/photos/images/masonry/000/325/721/721.jpeg)
![KICKSTARTER behind the numbers the failures As of s/2/2012 $214,588,334 pledged 2,974,842 bac kers 45,815 projects 22,902 successful projects (B 5%) 18,939 failed projects (0 1%) Fated (41 3% of the $214,588,334 pledged.. $197,592,643 successful (92 1%} 16,995,69 Fated (7 9%) successfully funded % OF SUCCESSFUL PROJECTS Design Fam & Video Art 10 50 70 MOST MONEY RAISED Dance 1.8 MM Fashion 2.3 MM Comics 4.8 MM Food 1 MM Theater 6.8 MM 22.7 MM 6.3 MM Fim & Video 20 milion 40 milon 60 miaion MOST POPULAR/COMPETITIVE Comics 1,068 Food 1.471 # of projects submitted Fim & Video 2000 4000 6000 8000 10000 12000 1000 Dance ■26,326 Fashion .36,792 Pholography50,552 Food 85.179 # of backers 0 100000 200000 300000 400000 500000 600000 700000 Duration of Fundraising Campaign SUCCESSFUL PROJECTS AVERAGE AILED PROJECTS AVERAGE 38 43 VS DAYS DAYS Set Goal SUCCESSFUL ROJECTS AVERAGE FAILED PROJECTS AVERAGE $5,487 VS. $16,365 Lower goal 8.5% of funded projects received more than double their goal (>200%) PPS BLOGGER Sourcei Kickstarter.com](https://i.kym-cdn.com/photos/images/original/000/325/721/721.jpeg)
Infographic Dumps
![via <a href="http://mashable.com/2012/06/11/true-blood-premiere-social-media/">Mashable</a>](https://i.kym-cdn.com/photos/images/masonry/000/324/952/d81.jpg)
![via <a href="http://mashable.com/2012/06/11/true-blood-premiere-social-media/">Mashable</a>](https://i.kym-cdn.com/photos/images/original/000/324/952/d81.jpg)
Infographic Dumps
When Fruits are in Season
![when are they in season? autumn winter kumquats coconut cranberries _ persimmon -guava kiwi pineapple dates pomegranate- pears JAN spring -dewberries summer apples figs grapes mango & papaw watermelon & rhubarb tomatoes avocados berries cherries year-round passion fruit bananas citrus melons -plums & peaches *achenes, berries, drupes, hesperidia, infructescences, pepo, pomes sweet vegetables & other things we call fruits in the kitchen. rvank.com & chasingdelicious.com](https://i.kym-cdn.com/photos/images/masonry/000/322/718/fcb.jpg)
![when are they in season? autumn winter kumquats coconut cranberries _ persimmon -guava kiwi pineapple dates pomegranate- pears JAN spring -dewberries summer apples figs grapes mango & papaw watermelon & rhubarb tomatoes avocados berries cherries year-round passion fruit bananas citrus melons -plums & peaches *achenes, berries, drupes, hesperidia, infructescences, pepo, pomes sweet vegetables & other things we call fruits in the kitchen. rvank.com & chasingdelicious.com](https://i.kym-cdn.com/photos/images/original/000/322/718/fcb.jpg)
Infographic Dumps
When Vegetables are in Season
![vegetables when are they in season? autumn winter carrots &celery root chicory broccoli, cauliflower cabbage & kale _ daikon & parsnip squash pumpkin sweet potatoes -rutabaga & turnip leeks AN spring artichokes asparagus chives & ramps summer eggplant bell peppers okra Cucumber & zucchini year-round beets broccolini celery fennel ga ginger greens snap peas green beans & peas mushrooms new potatoes chard Spinach potatoes spinach sprouts *berries, buds, bulbs, leaves, legumes, mushrooms, pepo, roots, sheaths, shoots sprouts, stems, unsweet fruits & other things we call vegetables in the kitchen rvank.com & chasingdelicious.com](https://i.kym-cdn.com/photos/images/masonry/000/322/717/027.jpg)
![vegetables when are they in season? autumn winter carrots &celery root chicory broccoli, cauliflower cabbage & kale _ daikon & parsnip squash pumpkin sweet potatoes -rutabaga & turnip leeks AN spring artichokes asparagus chives & ramps summer eggplant bell peppers okra Cucumber & zucchini year-round beets broccolini celery fennel ga ginger greens snap peas green beans & peas mushrooms new potatoes chard Spinach potatoes spinach sprouts *berries, buds, bulbs, leaves, legumes, mushrooms, pepo, roots, sheaths, shoots sprouts, stems, unsweet fruits & other things we call vegetables in the kitchen rvank.com & chasingdelicious.com](https://i.kym-cdn.com/photos/images/original/000/322/717/027.jpg)
Infographic Dumps
![THE SELFISH CINTERN ET MEME Meme rhymes with cream Richard Dawkins n. An idea or belief system, or pattern of behavior that spreads throughout a cuiture Most popular definition of meme on was coined by Richard Dawkirs in h his seminal work Gene to describe self-replicacing units of culture, from religions to catchy tunes, that survive and spread withn society. pectfically describe viral content on the internet. These days it is also used to FAMOUS a MEMES The strongest memes are arguably those we don't even think of as memes anymore. It's not posible to understand it, and when you do understand it, then it's even worse Tom Green on memes What makes intenet memes a particularly modern phenonenon s our cel ebration of their mimetic qualities 1'going viral sseen as a good thing) and our habit of playing with them THE END STOO DAMN NIGH Hemetics ithe study of memes) is reiated to evolutionary theory, Strorg memes survive and weak memes don't. Based on this theery apparently successful memes such in Crazy Frog and Rickrolling are actuaily weak, as thay eventuily Crazy Frog Rickrolling Go gleinsights for Search On a long enough timeline the survival rate for everyone drops to zero. Tyler Durden (meme) 1999 Richard Diwkirs did an internet search of some recemtly coined words or fashionable expressions". Here's how the results compared to 2012 2012 1999 act that Dekins's method of using are not perfect, we can clearly see which memes are strong mentions as a gauge af popularity MILHOUSEIS NOT A MEME The Mihouse is not a meme' meme has been credited as an example of the first forced mene h the holy gral What maes hause urique hs that he wan punhed by anonymous users on 4chan, For a great description of this phenomenon check out knowyourmeme.com meme'. For advertisig and media agencies Longitudinally: A meme, such as a fairytale or song, is passed down rom on, generation to the nest. Horiaontally: A meme, such as viral Internet content, ts passed around : witin a peer group. vertical dssemination of as intemet there was this thing called Crazy Frog... and the whole thing starts agsin The best internet memes disguise their Everything on 4chan is Good Guy Greg SEED blue-eyed portrayals of Christ, which dieguise the fact thet Christianity started on another contrert. Or the fact that the word mone gradually d ancing Fnaly, here is the second most popular definition Meme n. Used to give a bit of pseudo-academic gravitas to stupid viral set. Produced by: NEO MAMMALIAN STUDIOS](https://i.kym-cdn.com/photos/images/masonry/000/313/186/19a.jpg)
![THE SELFISH CINTERN ET MEME Meme rhymes with cream Richard Dawkins n. An idea or belief system, or pattern of behavior that spreads throughout a cuiture Most popular definition of meme on was coined by Richard Dawkirs in h his seminal work Gene to describe self-replicacing units of culture, from religions to catchy tunes, that survive and spread withn society. pectfically describe viral content on the internet. These days it is also used to FAMOUS a MEMES The strongest memes are arguably those we don't even think of as memes anymore. It's not posible to understand it, and when you do understand it, then it's even worse Tom Green on memes What makes intenet memes a particularly modern phenonenon s our cel ebration of their mimetic qualities 1'going viral sseen as a good thing) and our habit of playing with them THE END STOO DAMN NIGH Hemetics ithe study of memes) is reiated to evolutionary theory, Strorg memes survive and weak memes don't. Based on this theery apparently successful memes such in Crazy Frog and Rickrolling are actuaily weak, as thay eventuily Crazy Frog Rickrolling Go gleinsights for Search On a long enough timeline the survival rate for everyone drops to zero. Tyler Durden (meme) 1999 Richard Diwkirs did an internet search of some recemtly coined words or fashionable expressions". Here's how the results compared to 2012 2012 1999 act that Dekins's method of using are not perfect, we can clearly see which memes are strong mentions as a gauge af popularity MILHOUSEIS NOT A MEME The Mihouse is not a meme' meme has been credited as an example of the first forced mene h the holy gral What maes hause urique hs that he wan punhed by anonymous users on 4chan, For a great description of this phenomenon check out knowyourmeme.com meme'. For advertisig and media agencies Longitudinally: A meme, such as a fairytale or song, is passed down rom on, generation to the nest. Horiaontally: A meme, such as viral Internet content, ts passed around : witin a peer group. vertical dssemination of as intemet there was this thing called Crazy Frog... and the whole thing starts agsin The best internet memes disguise their Everything on 4chan is Good Guy Greg SEED blue-eyed portrayals of Christ, which dieguise the fact thet Christianity started on another contrert. Or the fact that the word mone gradually d ancing Fnaly, here is the second most popular definition Meme n. Used to give a bit of pseudo-academic gravitas to stupid viral set. Produced by: NEO MAMMALIAN STUDIOS](https://i.kym-cdn.com/photos/images/original/000/313/186/19a.jpg)
Infographic Dumps
![THE STATE OF THE Every quarter, Akamai takes a look at con- nection speeds, attack traffic, network con- nectivity and more. Here's a look at the state of the Internet during 2011's fourth quarter INTERNET PENETRATION Globally, nearly 200 countries and regions saw year-over-year growth in the number of unique IP U.K 14% 25,383,604 Year-over-year change (%) Number of unique IPv4 addresses France 7.3% 24,797,259 35,608,453 1.8% 40,254,398 Korea 18,948,552 26% 84,405,405 27% 17,116,579 USA 5.7% 145,069,663 Italy 23% 15,093,132 20% 13,889.458 Global total of unique IP addresses: 628,358,806 The unique IP addresses across the top 10 countries represent nearly 67% of the global figure. GLOBAL AVERAGE CONNECTION SPEEDS The global average connection speed saw an unusual, and fairly significant decline in 2011 Q4; however, for the year, the global average connection speed was up 19%. Akamai came up with a ist of the top 100 cities with the highest aver- age connection speeds. Of those cities: At a city level, South Korea and Japan hold many of the top spots. Most were in South Korea and Japan. 24 Number of cities from Europe on the top 100 list. 69 No U.S. c placed in the top 50; Boston ranked 51st. Number of cities from North America on the top 100 list. The global average connection speed was 2.3 Mbps, the global average peak connection speed was 11.7 Mbps Number of cities from the Asia Pacific region on the top 100 list. Average measured connection speed Average measured Mbps and year-over-year change (%), 2011 Q4) 7.3 Mbps 2996 9.1 Mbps -2.6% 5.8 Mbps 6.1 Mbps 1096 8.2 Mbps 18% 17.5 Mbps 28% 6.4 Mbps -8.5% 6.7 Mbps 18% 7.8 Mbps 31% 6.8 Mbps 9.1 Mbps 10% Sources:The State of the Internet (2011 04) royal.pingdom.com Information provided by: http://www.onlineuniversities.com/ Online Universities.com](https://i.kym-cdn.com/photos/images/masonry/000/301/519/3be.jpg)
![THE STATE OF THE Every quarter, Akamai takes a look at con- nection speeds, attack traffic, network con- nectivity and more. Here's a look at the state of the Internet during 2011's fourth quarter INTERNET PENETRATION Globally, nearly 200 countries and regions saw year-over-year growth in the number of unique IP U.K 14% 25,383,604 Year-over-year change (%) Number of unique IPv4 addresses France 7.3% 24,797,259 35,608,453 1.8% 40,254,398 Korea 18,948,552 26% 84,405,405 27% 17,116,579 USA 5.7% 145,069,663 Italy 23% 15,093,132 20% 13,889.458 Global total of unique IP addresses: 628,358,806 The unique IP addresses across the top 10 countries represent nearly 67% of the global figure. GLOBAL AVERAGE CONNECTION SPEEDS The global average connection speed saw an unusual, and fairly significant decline in 2011 Q4; however, for the year, the global average connection speed was up 19%. Akamai came up with a ist of the top 100 cities with the highest aver- age connection speeds. Of those cities: At a city level, South Korea and Japan hold many of the top spots. Most were in South Korea and Japan. 24 Number of cities from Europe on the top 100 list. 69 No U.S. c placed in the top 50; Boston ranked 51st. Number of cities from North America on the top 100 list. The global average connection speed was 2.3 Mbps, the global average peak connection speed was 11.7 Mbps Number of cities from the Asia Pacific region on the top 100 list. Average measured connection speed Average measured Mbps and year-over-year change (%), 2011 Q4) 7.3 Mbps 2996 9.1 Mbps -2.6% 5.8 Mbps 6.1 Mbps 1096 8.2 Mbps 18% 17.5 Mbps 28% 6.4 Mbps -8.5% 6.7 Mbps 18% 7.8 Mbps 31% 6.8 Mbps 9.1 Mbps 10% Sources:The State of the Internet (2011 04) royal.pingdom.com Information provided by: http://www.onlineuniversities.com/ Online Universities.com](https://i.kym-cdn.com/photos/images/original/000/301/519/3be.jpg)
Infographic Dumps
![MOSS GRAFFITI 3 handfuls moss 3 c (700 ml) lukewarrn water Crumble mos pour water 2 tbsp retention gel Add gardening gel (120 ml) buttermik Add buttermik Pulse blender until gel forms Transfer to a bucket Paint onto wood or rough concrete. Mist weekly Watch your art grow certainly not me officer... Ze best in ze world! REALLOL.COM](https://i.kym-cdn.com/photos/images/masonry/000/295/609/3c0.jpg)
![MOSS GRAFFITI 3 handfuls moss 3 c (700 ml) lukewarrn water Crumble mos pour water 2 tbsp retention gel Add gardening gel (120 ml) buttermik Add buttermik Pulse blender until gel forms Transfer to a bucket Paint onto wood or rough concrete. Mist weekly Watch your art grow certainly not me officer... Ze best in ze world! REALLOL.COM](https://i.kym-cdn.com/photos/images/original/000/295/609/3c0.jpg)
Infographic Dumps
![www.istrat The size of the Mobile market i Strateg;y 1.5bn Televisions worldwide 1.4bn Internet users worldwide 4bn Mobile phone worldwide 7·13% Traded Stocks and Financial 6.69% Movie Information 5.33% Business Directory 480m Daily n cation 20.21 % Social 3.05bn SMS users worldwide Entertainment most used communication tool on the planet 48.7% News and Sports 600m 46% use both PC and Mobile worldwide 29% from Mobile 1.3bn Email users worldwide ,.37% Myxer 10.99% 25% from Mobile 5.03% WeeWorld Mobilc 19% RIM 13% 4.75% Cricket 19.39% 2.98% Phone Zoo 2.73% Sprint Pictures 2.53% Yahoo Mobile 2.38% Fun for Mobile 2.38% 45% 19% 14% 51% $800bn $600bn 49.5% $200bn Windows Mobile $150bn 6% $130bn Messaging $70bn 97.57% 9.1% 6.9% 6.0% 5.2% RIM Blackberry Blackberry Centro Dream 8300 23.3% of market made up of traffic from other smartphones RIM Palm HTC 8100 1.94% Yahoo 0.25% Ask 0.1 1 % MSN the number of mobiles for every 100 people within that country. Chart shows for example: in United States there are 48.81 mobiles for every 100 people のト 100 people 1) Source: www.comscore.com | www.webdevelopersnotes.com | www.marketingcharts.com metrics.admob.com | Tomi Ahonern](https://i.kym-cdn.com/photos/images/masonry/000/291/546/fa5.png)
![www.istrat The size of the Mobile market i Strateg;y 1.5bn Televisions worldwide 1.4bn Internet users worldwide 4bn Mobile phone worldwide 7·13% Traded Stocks and Financial 6.69% Movie Information 5.33% Business Directory 480m Daily n cation 20.21 % Social 3.05bn SMS users worldwide Entertainment most used communication tool on the planet 48.7% News and Sports 600m 46% use both PC and Mobile worldwide 29% from Mobile 1.3bn Email users worldwide ,.37% Myxer 10.99% 25% from Mobile 5.03% WeeWorld Mobilc 19% RIM 13% 4.75% Cricket 19.39% 2.98% Phone Zoo 2.73% Sprint Pictures 2.53% Yahoo Mobile 2.38% Fun for Mobile 2.38% 45% 19% 14% 51% $800bn $600bn 49.5% $200bn Windows Mobile $150bn 6% $130bn Messaging $70bn 97.57% 9.1% 6.9% 6.0% 5.2% RIM Blackberry Blackberry Centro Dream 8300 23.3% of market made up of traffic from other smartphones RIM Palm HTC 8100 1.94% Yahoo 0.25% Ask 0.1 1 % MSN the number of mobiles for every 100 people within that country. Chart shows for example: in United States there are 48.81 mobiles for every 100 people のト 100 people 1) Source: www.comscore.com | www.webdevelopersnotes.com | www.marketingcharts.com metrics.admob.com | Tomi Ahonern](https://i.kym-cdn.com/photos/images/original/000/291/546/fa5.png)
Infographic Dumps
Infographic Dumps
![World map of social networks Russia UK aebook Germany Vkontakte Odnoklassniki Facebook Twitter Linkedin Facebook Xing Twitter ChinaJapan USA Facebook Twitter Linkedin Gzone Sina Weibo Renren Spain Facebook Linkedin Twitter Tuenti Facebook Twitter Mixi Egypt India .com Facebook Linkedin Twitter Orkut Facebook Twitter Brazil Facebook Orkut Twitter South Africa Facebook Twitter Linkedin Australia Facebook Twitter Linkedin Social networks with the largest number of registered users, mln people Facebook aZone Twitter Linkedin Renren Vkontakte Odnoklassniki Orkut Myspace Livelournal 800 505 256 135 112 95 63 35 Chart data from various sources for March 2011-January 2012. Map data for Jonuary 2012. Source Alexo.com](https://i.kym-cdn.com/photos/images/masonry/000/290/967/c90.jpg)
![World map of social networks Russia UK aebook Germany Vkontakte Odnoklassniki Facebook Twitter Linkedin Facebook Xing Twitter ChinaJapan USA Facebook Twitter Linkedin Gzone Sina Weibo Renren Spain Facebook Linkedin Twitter Tuenti Facebook Twitter Mixi Egypt India .com Facebook Linkedin Twitter Orkut Facebook Twitter Brazil Facebook Orkut Twitter South Africa Facebook Twitter Linkedin Australia Facebook Twitter Linkedin Social networks with the largest number of registered users, mln people Facebook aZone Twitter Linkedin Renren Vkontakte Odnoklassniki Orkut Myspace Livelournal 800 505 256 135 112 95 63 35 Chart data from various sources for March 2011-January 2012. Map data for Jonuary 2012. Source Alexo.com](https://i.kym-cdn.com/photos/images/original/000/290/967/c90.jpg)
Infographic Dumps
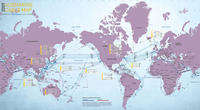
The World Map of Submarine Communications Cable
![All continents but Antarctica are interconnected through "submarine communications cable":http://en.wikipedia.org/wiki/Submarine_communications_cable.](https://i.kym-cdn.com/photos/images/masonry/000/290/965/b32.jpg)
![All continents but Antarctica are interconnected through "submarine communications cable":http://en.wikipedia.org/wiki/Submarine_communications_cable.](https://i.kym-cdn.com/photos/images/original/000/290/965/b32.jpg)
Infographic Dumps
![WEB TREND MAP 4 The State of the Web Mapped onto Tokyo's Metro System MySpace](https://i.kym-cdn.com/photos/images/masonry/000/290/962/f11.png)
![WEB TREND MAP 4 The State of the Web Mapped onto Tokyo's Metro System MySpace](https://i.kym-cdn.com/photos/images/original/000/290/962/f11.png)
Infographic Dumps
![THE INTERNET WE ALL KNOW THE INTERNET IS EIG BUT DID YOIENIN irs SD EIG 1HAT IT'S RACTICALLY IMPOSSI3LE TU MEASURE WITH SO NUCH INFORMATION AVAILABLE AT THE TUCH OF A 1UTTEN, ITS EASY TI SEE HUW 73% OF PEOPLE FEEL THAT THE AMOUNT OF AVAILA3LE DATA IS INERWHELMING, HERES AUITTLE PERSPECTIVE ON THEINTERNET ABOUT 5 MILLION TERABYTES OF DATA. WHICH IS 5 BILLION GIGABYTES OR 5 TRILLION MEGABYTES RABYTESTHE HUMANB TERABYTES PER BRAIN. IT TERABYTE 9000 SO 200 MILLION MORE THAN 1 BILLION DS COULD HOLD THE INTERNET POPULATION WORLD AVERAGE: 26.6% LATIN AMERICA AND CA RIBBEAN: 31 247 BILLION EMAILS ARE SENT EVERY DAY 81% ARE SPAM (200 BILLION SPAM EMAILS EVERY DAY 90 TRILLION EMAILS WERE SENT EVERY YEAR IT IS DIFFICULT TO SAY F THE LEISURE TIME SECAUSE A BOTH AT THE SAME TIME OF AMERICANS USE THE INTERNET AND TELEVISION FML! TEENAGERS SPEND ON AVERAGE 31 HOURS ONLINE EVERY WEEK. PREGNANGY SITES LOSS AND DIET SITES N ONE HOURIS SPENT LOOING UP PLAS THERE ARE 234 MILLION WEBSITES AND 126 MILLION BLOGS. 1 BLOGGING BREAKDOWN AGE: TOP 5 COUNTRIES 1.USA : 29.22% 2. UK: 6.75% 4. BRAZIL : 4.19% 5, CANADA : 3.93% GENDER 36-50 FEMALE EVERY SECOND 28,258 INTERNET USERS ARE WATCHING P---------- 9. MOBILE INTERNET NTERNET USERS MOENTMORI THANS MINVTES EACH ORSOCIAL 10, WHAT ARE PEOPLE USING MOBILE INTERNET FOR? 10% 34% HAS 105 MILLION RECISTERED USERS HAS MORE THAN 400 MILLION ACTIVE USERS HAS 120-124 MILLION U VIEWERS, WHICH Is 1/3 OFTHE ENTIRE US POPULATION ACEBOOK HASMORE THAN MILLION PAGE VIEWS PER MINUTE: 37.4 TRILLION EVERY YEAR 2.5 BILLION IMAGES ARE UPLOADED TO FACEBOOK EACH MONTH. 12. 20 HOURS OF VIDEOS ARE UPLOADED TO YOUTUBE EVERY MINUTE. THATS COMPARABLE RELEASING 86,000 NEW FILMS 12.2 BILLION VIDEOS ARE VIEWED EACH MONTH OF YOUTUBE USERS VISIT THE SITE A WEEK OR MORE 14 24 MILLION VIDEOS ARE WATCHED ONnUlu EACH MONTH IN THE U.S. ALONE 15 50 MILLION TWEETS EVERYDAY 2.5 MILLION PER DAY 300,000 TODAY, THERE ARE 600 TWEETS PER SECOND](https://i.kym-cdn.com/photos/images/masonry/000/290/961/f67.jpg)
![THE INTERNET WE ALL KNOW THE INTERNET IS EIG BUT DID YOIENIN irs SD EIG 1HAT IT'S RACTICALLY IMPOSSI3LE TU MEASURE WITH SO NUCH INFORMATION AVAILABLE AT THE TUCH OF A 1UTTEN, ITS EASY TI SEE HUW 73% OF PEOPLE FEEL THAT THE AMOUNT OF AVAILA3LE DATA IS INERWHELMING, HERES AUITTLE PERSPECTIVE ON THEINTERNET ABOUT 5 MILLION TERABYTES OF DATA. WHICH IS 5 BILLION GIGABYTES OR 5 TRILLION MEGABYTES RABYTESTHE HUMANB TERABYTES PER BRAIN. IT TERABYTE 9000 SO 200 MILLION MORE THAN 1 BILLION DS COULD HOLD THE INTERNET POPULATION WORLD AVERAGE: 26.6% LATIN AMERICA AND CA RIBBEAN: 31 247 BILLION EMAILS ARE SENT EVERY DAY 81% ARE SPAM (200 BILLION SPAM EMAILS EVERY DAY 90 TRILLION EMAILS WERE SENT EVERY YEAR IT IS DIFFICULT TO SAY F THE LEISURE TIME SECAUSE A BOTH AT THE SAME TIME OF AMERICANS USE THE INTERNET AND TELEVISION FML! TEENAGERS SPEND ON AVERAGE 31 HOURS ONLINE EVERY WEEK. PREGNANGY SITES LOSS AND DIET SITES N ONE HOURIS SPENT LOOING UP PLAS THERE ARE 234 MILLION WEBSITES AND 126 MILLION BLOGS. 1 BLOGGING BREAKDOWN AGE: TOP 5 COUNTRIES 1.USA : 29.22% 2. UK: 6.75% 4. BRAZIL : 4.19% 5, CANADA : 3.93% GENDER 36-50 FEMALE EVERY SECOND 28,258 INTERNET USERS ARE WATCHING P---------- 9. MOBILE INTERNET NTERNET USERS MOENTMORI THANS MINVTES EACH ORSOCIAL 10, WHAT ARE PEOPLE USING MOBILE INTERNET FOR? 10% 34% HAS 105 MILLION RECISTERED USERS HAS MORE THAN 400 MILLION ACTIVE USERS HAS 120-124 MILLION U VIEWERS, WHICH Is 1/3 OFTHE ENTIRE US POPULATION ACEBOOK HASMORE THAN MILLION PAGE VIEWS PER MINUTE: 37.4 TRILLION EVERY YEAR 2.5 BILLION IMAGES ARE UPLOADED TO FACEBOOK EACH MONTH. 12. 20 HOURS OF VIDEOS ARE UPLOADED TO YOUTUBE EVERY MINUTE. THATS COMPARABLE RELEASING 86,000 NEW FILMS 12.2 BILLION VIDEOS ARE VIEWED EACH MONTH OF YOUTUBE USERS VISIT THE SITE A WEEK OR MORE 14 24 MILLION VIDEOS ARE WATCHED ONnUlu EACH MONTH IN THE U.S. ALONE 15 50 MILLION TWEETS EVERYDAY 2.5 MILLION PER DAY 300,000 TODAY, THERE ARE 600 TWEETS PER SECOND](https://i.kym-cdn.com/photos/images/original/000/290/961/f67.jpg)
Infographic Dumps