Venn Diagram Parodies
Confirmed 43,428
Part of a series on LOLgraphs. [View Related Entries]
Venn Diagram Parodies
Part of a series on LOLgraphs. [View Related Entries]
About
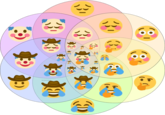
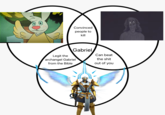
Venn Diagram Parodies refers to a series of mock Venn diagram charts, which show unexpected and humorous similarities between two or more disparate groups represented by various circular shapes. The groups are labeled in the center of the circle, untouched by other circles, while the similarities are represented by the portions of the circle that intersect. Since at least the mid-2000s, various Venn Diagram memes have been widely circulated online across a number of sites and social media platforms.
Origin
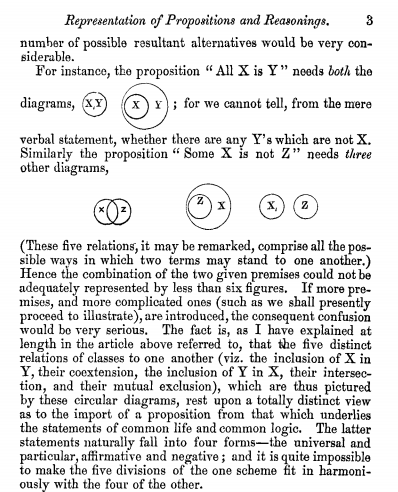
In July 1880 English logician and philosopher John Venn introduced the Venn Diagram in a paper entitled "On the Diagrammatic and Mechanical Representation of Propositions and Reasonings" for the Philosophical Magazine and Journal of Science (shown below).[1]

While parodies of Venn diagrams have likely existed since the form's coming to prominence, one of the earliest parodies published online was posted on the website Indexed[2] on August 9th, 2006. The examples shows three circles, labeled "Easter Bunny," "Santa Claus" and "Tooth Fairy," and the center intersection labeled "Religious doubt" (shown below).

Spread
Over the next decade, parody Venn diagrams grew in popularity online. On June 4th, 2008, a blogger on Warwick.ac.uk[3] posted one about the Jolly Green Giant, vegetable mascot (shown below, left). Two years later, on December 17th, 2010, the website Chartporn[4] posted a Christmas-themed parody (shown below, right). The following year, on April 10th, 2011, Tumblr [5] user lateenough posted one about various social media cites and what personality disorders it reflects (shown below, right).


On January 13th, 2015, the website Mental Floss[6] published a listicle of various mock venn diagrams.
Put Your Hands Up
Three years later, on August 20th, 2018, Twitter [7] user @adamklevy tweeted a three-part diagram based around the types of people that ask others to "Put your hands up." The post (shown below) received more than 2,900 retweets and 7,000 likes in nine days.

The post inspired others to post variations of the "put your hands up" Venn diagram, adding more circles. Twitter[8] user @mattsurely tweeted a variation that added such circles as "mom taking off your sweater." The post (shown below, left) received more than 3,700 and 10,000 likes in one week.
The following day, Twitter[9] user @_ericcurtin posted a parody of "put your hands up," replacing the center intersection with "Dinner is at 7pm tonight, please try to make it. It would make your mom really happy." The post (shown below, center) received more than 850 retweets and 6,900 likes in six days.
Others, however, mocked the trend, comparing it to other recent memes, such as Business Handshake and Epic Handshake. Twitter[10] account Pixelated Boat posted an Epic Handshake about the Venn diagrams. The post (shown below, right) received more than 1,700 retweets and 10,000 likes in six days.
On August 28th, The Daily Dot [11] posted a listicle of popular examples of the meme.


Various Examples


Search Interest
External References
[1] UPenn – Philosophical Magazine
[2] Indexed – How tenuous, that imaginary friendship. – Indexed
[3] Warwick – Jolly, Green, and Giant
[4] Chartporn – The Santa Brand – Chart Porn
[5] Tumblr LateEnough's Post
[6] Mental Floss – 12 Funny and Delicious Venn Diagrams
[7] Twitter – @adamklevy's Tweet
[8] Twitter – @mattsurely's Tweet
[9] Twitter – @_ericcurtin's Tweet
[10] Twitter – @pixelatedboat's Tweet
[11] The Daily Dot – How a Venn Diagram Meme Comparing DJs to Preachers Went Viral on Twitter
Recent Videos
There are no videos currently available.
Recent Images 80 total
Share Pin
Related Entries 1 total
Recent Images 80 total
Recent Videos 0 total
There are no recent videos.


