Yo! You must login or signup first!

Meme Encyclopedia
Media
Editorials
More

Popular right now

Italian Brainrot / AI Italian Animals image and meme examples.

Italian Brainrot Animals

Mateus Lima

Mateus Lima • 26 days ago

Tung Tung Tung Sahur meme image examples.

Tung Tung Tung Sahur

Sakshi Rakshale

Sakshi Rakshale • 22 days ago

AI image of a crocodile's face merged with a military bomber.

Bombardiro Crocodilo

Mateus Lima

Mateus Lima • about a month ago

Tralalero Tralala meme example.

Tralalero Tralala

Sakshi Rakshale

Sakshi Rakshale • about a month ago

Luigi Mangione Sex Tapes Rumor image and tweet example.

Luigi Mangione Sex Tapes Rumor

Philipp Kachalin

Philipp Kachalin • about a month ago

Know Your Meme is the property of Literally Media ©2024 Literally Media. All Rights Reserved.
Red-stock-market-map

Submission   675

Part of a series on Orange Monday / 2025 Stock Market Crash. [View Related Entries]


About

The Red S&P 500 Stock Market Map, also known as the Red S&P 500 Heatmap, refers to a data visualization chart of the U.S. stock market in a recession or crash, showing stocks in the Standard & Poor’s 500 (S&P 500) index as squares and rectangles, with the most widely held stocks, like Google and Amazon, taking up most of the space. The map is hosted on the website Finviz (finviz.com), among others. All-red screenshots of the map trended en masse in early 2025, mostly due to President Donald Trump's reciprocal tariffs, which caused the 2025 Stock Market Crash. The all-red map was also called the "Xi of Red," referencing Chinese President Xi Jinping, likening the U.S. stock market crash to China's growing trade influence and industry growth. Notably, the Xi of Red went viral when the Chinese generative AI system DeepSeek was launched as a competitor to ChatGPT in January 2025. The Red Stock Market Map became an exploitable in memes about the 2025 Stock Market Crash and the likelihood of a U.S. recession that year. For instance, the Red Stock Market Map was used in abstract Fell For It Again Award memes about President Trump's voters in the 2024 U.S. Presidential Election.

Origin

Finviz.com[1] was created on August 11th, 2007.[2] One of the website's features is an interactive map (or heatmap) of all S&P 500 stocks.[3] The map was first added to the Internet Archive[4] on January 10th, 2008. Tweets[5][6] about the map first surfaced in May 2009.

In 2018, internet discourse about the S&P Map being all-red surfaced en masse, evident in a post by Redditor bigbear0083 to the /r/StockMarket[8] subreddit on February 8th, 2018, gaining over 420 upvotes in seven years (shown below). The post was about tariffs and tax cuts granted by President Donald Trump's first administration.[9]
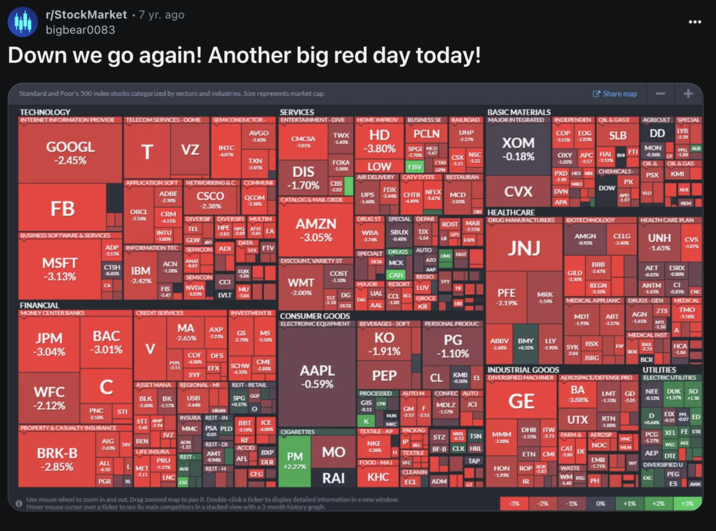
An early example of a Red S&P 500 Stock Market Map being used on "Reddit":https://knowyourmeme.com/memes/sites/reddit from 2018, about "U.S.":https://knowyourmeme.com/memes/cultures/united-states-of-america President "Donald Trump":https://knowyourmeme.com/memes/people/donald-trump in his first term.

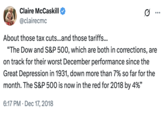
On December 17th, 2018, X[7] user @clairecmc tweeted about the S&P 500 Map being red due to the tariffs and tax cuts granted by President Donald Trump's first administration, gaining over 3,000 likes in six years (shown below).

A "tweet":https://knowyourmeme.com/memes/sites/twitter-x about "U.S.":https://knowyourmeme.com/memes/cultures/united-states-of-america President "Donald Trump":https://knowyourmeme.com/memes/people/donald-trump in his first term and the Red S&P 500 Stock Market Map.

Spread

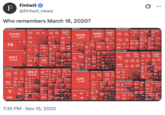
On March 16th, 2020, the S&P 500 Map went almost entirely red because of the COVID-19 pandemic. X[10] user @fintwit_news tweeted, "Who remembers March 16, 2020?" on the day with a screencap of the map, gaining over 1,700 likes in five years (shown below).

The tweet was reposted on Instagram [11] in October 2024.

A "tweet":https://knowyourmeme.com/memes/sites/twitter-x about the S&P 500 Stock Market Map going all red on March 16th, 2020, coinciding with the "COVID-19 Pandemic":https://knowyourmeme.com/memes/events/covid-19-pandemic.

The Red S&P 500 Stock Market Map became a notable meme in early 2025 when the Chinese artificial intelligence company DeepSeek was released on January 20th, causing many of the S&P 500 stocks to go red on January 27th, 2025.[12]

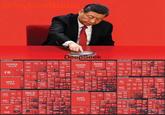
On January 27th, X[13] user @MyLordBebo posted a meme showing Chinese President Xi Jinping pushing a DeepSeek button that made the S&P 500 map go red, gaining over 17,000 likes in three months (shown below).

A "meme":https://knowyourmeme.com/memes/memes showing "Chinese":https://knowyourmeme.com/memes/cultures/china President "Xi Jinping":https://knowyourmeme.com/memes/people/xi-jinping pushing a button that says, "DeepSeek":https://knowyourmeme.com/memes/sites/deepseek," causing a Red S&P 500 Stock Market Map.

In March 2025, more memes using the Red S&P 500 Map as an exploitable surfaced online.

For instance, on March 10th, Redditor Equivalent_Baker_773 shared a meme to the /r/wallstreetbet[14] subreddit, showing a Babyface J.D. Vance edit saying, "Have You Said Thank You Once?" with the red map behind him, gaining over 53,000 upvotes in a month (shown below).

A "Have You Said Thank You Once":https://knowyourmeme.com/memes/jd-vance-have-you-said-thank-you-once meme using the Red S&P 500 Stock Market Map behind Vice President "J.D. Vance":https://knowyourmeme.com/memes/people/jd-vance.

On April 6th, 2025, X[15] user @saddest_miku shared a meme that combined the Fell For It Again Award with the Red S&P 500 Map to form a scene from Neon Genesis Evangelion, gaining over 84,000 likes in three days (shown below).

A "meme":https://knowyourmeme.com/memes/memes that combines the "Fell For It Again Award":https://knowyourmeme.com/editorials/guides/what-is-the-fell-for-it-again-award-meme-the-got-what-i-voted-for-award-meme-and-other-variants-explained with the Red S&P 500 Map to form a scene from "_Neon Genesis Evangelion_":https://knowyourmeme.com/memes/subcultures/neon-genesis-evangelion.

Various Examples

A "webcomic":https://knowyourmeme.com/memes/cultures/webcomics showing a character practicing "Red Light Therapy."
1439 4.371 Kramer, what's going on in there? THAT Sky Serves CSGP -3.08% Houlth Infrodigy) SMMT CORT Tinto Inting) It's the tariffs, Jerry. P Energy Howe
Board /pol/ - Politically Incorrect Settings Mobile Home 04/04/25(Fri)18:39:37 No.502354194 Anonymous (ID: AIMIC3x+ Electrick Technology) CSGP -3.08% SMMT Industrial Service 144 KB JPG You know the last time tariffs were introduced was in 1930 and it led the great depression followed by WW2. Here's your great reset. Anonymous (ID: ¡OHC5aOv)! >>502354194 (OP) 04/04/25(Fri)18:40:50 No.502354288 Sign tappers continue to be proven right. Anonymous (ID: qOEWD+NZ 40 KB JPG 04/04/25(Fri)18:41:06 No.502354313 >>502354194 (OP) >LEFTISTS NOW CARE ABOUT BILLION DOLLAR COMPANIES, BOOMER 401ks AND THE TOP 1%
TECHNOLOGY SOFTWARE-INFRASTRUCTURE MSFT -4.57% SEMICONDUCTORS NVDA -12.30% FINANCIAL 011101101101101001110 UTION CAUTION CAUTION HOUGH AR CY ORCL 4.43% GOOG -4.63% INFOR -4.09 TSM -8.49% AVGO 7,04% SAP 435 INTU 271 TXN AMD -5.67 -1.52 ARM SEMICON COMMU MU ASML -652 3.88% COMPUT ADI AMAT BANKS-REGION INSURANCE CAPITA FINAN MS GS SPG| BRK-A -3.38% TMUS ACN 327 VZ T FI CONSUMER ELECTRONICS AAPL -6.43% SOFTWARE-APPLI CRM NOW OVER 435550 COMMUNICATION SER INTERNET CONTENT&INFOR TELECOM SERVE ENTERT CONSUMER CYCLICAL INTERNET RETAL RESTA HOME DESCOUNT CONSUMER D META 592x AMZN HD WMT CO -7.20% TRAVEL NFLX FOO SARA 337 3 AUTO MANUFACT TM DIS TSLA 960% HEALTHCARE DRUG MANUFACTURERS-GEN INDUSTR ABBV AZN JNJ 024% -0.05% -33% AEROSPAC GE NVS PE 181381 MRK 1.02% AMON GD INO MEDICAL DEVIC RAILR SYK BANKS-DIVER JPM BAC -3.81% -6.33 IBN WFC -5.61 C CREDIT SERVICES AXP BX HSBC V MA -1.94% -1.30 TD 4.52 UBS RY ASSET MANA BLK BN Use mouse wheel to zoom in and out. Drag zoom Double-click a ticker to display detailed informa Hover mouse cursor over a ticker to see its main view with a 3-month history graph.
WE'RE TIRED OF WINNING MR. PRESIDENT!!!

Search Interest

External References


Share Pin

Recent Images 13 total


Recent Videos 0 total

There are no recent videos.



Red Stock Market Map meme and image example.

Red S&P 500 Stock Market Map

Part of a series on Orange Monday / 2025 Stock Market Crash. [View Related Entries]

Updated Apr 09, 2025 at 05:01PM EDT by Zach.

Added Apr 09, 2025 at 11:03AM EDT by Owen.

PROTIP: Press 'i' to view the image gallery, 'v' to view the video gallery, or 'r' to view a random entry.

This submission is currently being researched & evaluated!

You can help confirm this entry by contributing facts, media, and other evidence of notability and mutation.

About

The Red S&P 500 Stock Market Map, also known as the Red S&P 500 Heatmap, refers to a data visualization chart of the U.S. stock market in a recession or crash, showing stocks in the Standard & Poor’s 500 (S&P 500) index as squares and rectangles, with the most widely held stocks, like Google and Amazon, taking up most of the space. The map is hosted on the website Finviz (finviz.com), among others. All-red screenshots of the map trended en masse in early 2025, mostly due to President Donald Trump's reciprocal tariffs, which caused the 2025 Stock Market Crash. The all-red map was also called the "Xi of Red," referencing Chinese President Xi Jinping, likening the U.S. stock market crash to China's growing trade influence and industry growth. Notably, the Xi of Red went viral when the Chinese generative AI system DeepSeek was launched as a competitor to ChatGPT in January 2025. The Red Stock Market Map became an exploitable in memes about the 2025 Stock Market Crash and the likelihood of a U.S. recession that year. For instance, the Red Stock Market Map was used in abstract Fell For It Again Award memes about President Trump's voters in the 2024 U.S. Presidential Election.

Origin

Finviz.com[1] was created on August 11th, 2007.[2] One of the website's features is an interactive map (or heatmap) of all S&P 500 stocks.[3] The map was first added to the Internet Archive[4] on January 10th, 2008. Tweets[5][6] about the map first surfaced in May 2009.

In 2018, internet discourse about the S&P Map being all-red surfaced en masse, evident in a post by Redditor bigbear0083 to the /r/StockMarket[8] subreddit on February 8th, 2018, gaining over 420 upvotes in seven years (shown below). The post was about tariffs and tax cuts granted by President Donald Trump's first administration.[9]


An early example of a Red S&P 500 Stock Market Map being used on "Reddit":https://knowyourmeme.com/memes/sites/reddit from 2018, about "U.S.":https://knowyourmeme.com/memes/cultures/united-states-of-america President "Donald Trump":https://knowyourmeme.com/memes/people/donald-trump in his first term.

On December 17th, 2018, X[7] user @clairecmc tweeted about the S&P 500 Map being red due to the tariffs and tax cuts granted by President Donald Trump's first administration, gaining over 3,000 likes in six years (shown below).


A "tweet":https://knowyourmeme.com/memes/sites/twitter-x about "U.S.":https://knowyourmeme.com/memes/cultures/united-states-of-america President "Donald Trump":https://knowyourmeme.com/memes/people/donald-trump in his first term and the Red S&P 500 Stock Market Map.

Spread

On March 16th, 2020, the S&P 500 Map went almost entirely red because of the COVID-19 pandemic. X[10] user @fintwit_news tweeted, "Who remembers March 16, 2020?" on the day with a screencap of the map, gaining over 1,700 likes in five years (shown below).

The tweet was reposted on Instagram [11] in October 2024.


A "tweet":https://knowyourmeme.com/memes/sites/twitter-x about the S&P 500 Stock Market Map going all red on March 16th, 2020, coinciding with the "COVID-19 Pandemic":https://knowyourmeme.com/memes/events/covid-19-pandemic.

The Red S&P 500 Stock Market Map became a notable meme in early 2025 when the Chinese artificial intelligence company DeepSeek was released on January 20th, causing many of the S&P 500 stocks to go red on January 27th, 2025.[12]

On January 27th, X[13] user @MyLordBebo posted a meme showing Chinese President Xi Jinping pushing a DeepSeek button that made the S&P 500 map go red, gaining over 17,000 likes in three months (shown below).


A "meme":https://knowyourmeme.com/memes/memes showing "Chinese":https://knowyourmeme.com/memes/cultures/china President "Xi Jinping":https://knowyourmeme.com/memes/people/xi-jinping pushing a button that says, "DeepSeek":https://knowyourmeme.com/memes/sites/deepseek," causing a Red S&P 500 Stock Market Map.

In March 2025, more memes using the Red S&P 500 Map as an exploitable surfaced online.

For instance, on March 10th, Redditor Equivalent_Baker_773 shared a meme to the /r/wallstreetbet[14] subreddit, showing a Babyface J.D. Vance edit saying, "Have You Said Thank You Once?" with the red map behind him, gaining over 53,000 upvotes in a month (shown below).


A "Have You Said Thank You Once":https://knowyourmeme.com/memes/jd-vance-have-you-said-thank-you-once meme using the Red S&P 500 Stock Market Map behind Vice President "J.D. Vance":https://knowyourmeme.com/memes/people/jd-vance.

On April 6th, 2025, X[15] user @saddest_miku shared a meme that combined the Fell For It Again Award with the Red S&P 500 Map to form a scene from Neon Genesis Evangelion, gaining over 84,000 likes in three days (shown below).


A "meme":https://knowyourmeme.com/memes/memes that combines the "Fell For It Again Award":https://knowyourmeme.com/editorials/guides/what-is-the-fell-for-it-again-award-meme-the-got-what-i-voted-for-award-meme-and-other-variants-explained with the Red S&P 500 Map to form a scene from "_Neon Genesis Evangelion_":https://knowyourmeme.com/memes/subcultures/neon-genesis-evangelion.

Various Examples


A "webcomic":https://knowyourmeme.com/memes/cultures/webcomics showing a character practicing "Red Light Therapy." 1439 4.371 Kramer, what's going on in there? THAT Sky Serves CSGP -3.08% Houlth Infrodigy) SMMT CORT Tinto Inting) It's the tariffs, Jerry. P Energy Howe Board /pol/ - Politically Incorrect Settings Mobile Home 04/04/25(Fri)18:39:37 No.502354194 Anonymous (ID: AIMIC3x+ Electrick Technology) CSGP -3.08% SMMT Industrial Service 144 KB JPG You know the last time tariffs were introduced was in 1930 and it led the great depression followed by WW2. Here's your great reset. Anonymous (ID: ¡OHC5aOv)! >>502354194 (OP) 04/04/25(Fri)18:40:50 No.502354288 Sign tappers continue to be proven right. Anonymous (ID: qOEWD+NZ 40 KB JPG 04/04/25(Fri)18:41:06 No.502354313 >>502354194 (OP) >LEFTISTS NOW CARE ABOUT BILLION DOLLAR COMPANIES, BOOMER 401ks AND THE TOP 1% TECHNOLOGY SOFTWARE-INFRASTRUCTURE MSFT -4.57% SEMICONDUCTORS NVDA -12.30% FINANCIAL 011101101101101001110 UTION CAUTION CAUTION HOUGH AR CY ORCL 4.43% GOOG -4.63% INFOR -4.09 TSM -8.49% AVGO 7,04% SAP 435 INTU 271 TXN AMD -5.67 -1.52 ARM SEMICON COMMU MU ASML -652 3.88% COMPUT ADI AMAT BANKS-REGION INSURANCE CAPITA FINAN MS GS SPG| BRK-A -3.38% TMUS ACN 327 VZ T FI CONSUMER ELECTRONICS AAPL -6.43% SOFTWARE-APPLI CRM NOW OVER 435550 COMMUNICATION SER INTERNET CONTENT&INFOR TELECOM SERVE ENTERT CONSUMER CYCLICAL INTERNET RETAL RESTA HOME DESCOUNT CONSUMER D META 592x AMZN HD WMT CO -7.20% TRAVEL NFLX FOO SARA 337 3 AUTO MANUFACT TM DIS TSLA 960% HEALTHCARE DRUG MANUFACTURERS-GEN INDUSTR ABBV AZN JNJ 024% -0.05% -33% AEROSPAC GE NVS PE 181381 MRK 1.02% AMON GD INO MEDICAL DEVIC RAILR SYK BANKS-DIVER JPM BAC -3.81% -6.33 IBN WFC -5.61 C CREDIT SERVICES AXP BX HSBC V MA -1.94% -1.30 TD 4.52 UBS RY ASSET MANA BLK BN Use mouse wheel to zoom in and out. Drag zoom Double-click a ticker to display detailed informa Hover mouse cursor over a ticker to see its main view with a 3-month history graph. WE'RE TIRED OF WINNING MR. PRESIDENT!!!

Search Interest

External References

Recent Videos

There are no videos currently available.

Recent Images 13 total


+ Add a Comment

Comments (0)

There are no comments currently available.

Display Comments

Add a Comment


Meme Encyclopedia
Media
Editorials
More