| Navigation |
| About • Origin • Spread • Various Examples • Search Interest • External References • Recent Images |
About
A Sankey Diagram is a type of diagram used to visualize the movement and change of a subject from one state to another over a given length of time. Sankey diagrams were created by Irish captain Matthew Henry Phineas Riall Sankey in 1898, who first used the diagram to chart a steam engine's energy efficiency. Online, Sankey charts or graphs have been used for entertainment and memes to chart a variety of subjects, with one viral example being a Sankey diagram representing a Tinder user's day on the app. In February 2024, Aella used a Sankey diagram to chart her birthday gangbang, inspiring others to make comedic Sankey diagrams.
Origin
The first Sankey diagram was created by Irish captain Matthew Henry Phineas Riall Sankey in 1898 to visualize a steam engine's energy efficiency in a report titled "The Thermal Efficiency of Steam Engines."[1] Sankey diagrams are often used in the science and engineering fields.[2]

Spread
Sankey diagrams became increasingly popularized online throughout the 2000s, particularly on the subreddit /r/dataisbeautiful. Between 2007 and 2021, sankey-diagrams.com[3] shared numerous examples of Sankey diagrams charting a wide variety of subjects.
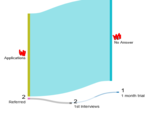
On May 10th, 2011, Tumblr[4] user ilovecharts posted a Sankey diagram charting how she falls for people, garnering over 150 notes in 13 years (shown below, left).
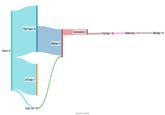
On May 9th, 2017, Redditor u/flashman posted a Sankey diagram to /r/dataisbeautiful[10] charting how 52 ninth-grade students spell "camouflage," garnering over 25,000 upvotes in seven years (shown below, right).

![How 52 ninth-graders spell 'camouflage', Sankey diagram [OC] C: 52 Cam: 50 Camof: 37 Camaf: 2 Camoflau: 20 Camofla: 12 Chamoflage: 1 Comaflouge: 1 Camouflage: 10 Camoaflage: 1 Camoflauge: 19 Camoflaugue: 1 Camoflage: 7 Camoflague: 5 Camoflouge: 5 Camaflauge: 1 Camaflouge: 1](https://i.kym-cdn.com/photos/images/newsfeed/002/766/820/085.jpg)
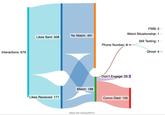
On January 20th, 2023, Redditor u/Square_Tea4916 posted a Sankey diagram to /r/dataisbeautiful[5] charting Netflix's profitability throughout 2022, garnering over 5,500 upvotes in a year. On September 12th, u/i_spill_things posted a Sankey diagram to /r/Tinder[6] charting a single day of Tinder use that led to her finding a life partner, garnering over 4,100 upvotes in six months (shown below).

On February 29th, 2024, OnlyFans and adult content creator Aella (AellaGirl) posted a Sankey diagram to X[7] charting her birthday gangbang event, garnering over 1,000 likes in a day (shown below).

The chart inspired other X users to post Sankey diagrams as memes shortly after, charting comedic subjects and referencing the Aella Sankey diagram.
For example, on March 1st, 2024, X[8] user @jack24dd30 posted a Sankey graph visualizing his Dune 2 birthday party, garnering over 300 likes in under a day (shown below). On the same day, X[9] user @SHL0MS posted a Sankey diagram about the ideation process, garnering around 30 likes in the same span of time.

Various Examples


Search Interest
External References
[1] Zenodo – The Thermal Efficiency of Steam Engines
[2] Wiley – The Sankey Diagram in Energy and Material Flow Management
[3] Sankey-diagrams – Homepage
[4] Tumblr – ilovegraphs
[5] Reddit – dataisbeautiful
[7] X – aella_girl
[8] X – jack24dd30
[10] Reddit – dataisbeautiful
Recent Videos
There are no videos currently available.
Recent Images 11 total
Share Pin
Recent Images 11 total
Recent Videos 0 total
There are no recent videos.


![How 52 ninth-graders spell 'camouflage', Sankey diagram [OC] C: 52 Cam: 50 Camof: 37 Camaf: 2 Camoflau: 20 Camofla: 12 Chamoflage: 1 Comaflouge: 1 Camouflage: 10 Camoaflage: 1 Camoflauge: 19 Camoflaugue: 1 Camoflage: 7 Camoflague: 5 Camoflouge: 5 Camaflauge: 1 Camaflouge: 1](https://i.kym-cdn.com/photos/images/list/002/766/820/085.jpg)


Comments ( 0 )
Sorry, but you must activate your account to post a comment.
Please check your email for your activation code.